Pagine

Friday, December 30, 2016

2016 Trading Results

2016 Trading Results 
from our Premium Service 
- The Daily Report -


  • Emini S&P500: +205 points
  • Emini S&P500 mid-term strategy***: +130 points
  • 30Y T-Bonds: +6.18 points (from February 2016)
  • Corn: +58 points per contract
  • Soybeans: +260 points per contract
  • Wheat: +40 points per contract (from February 2016)
  • Gold: -72 points per contract
  • Live Cattle: +8.21 points per contract (from June 2016)

***the mid-term strategy is a Daily trading strategy where I say when to buy or sell based only on the forecast.

In the last year we provided also a mid-term strategy for Soybeans, we made 7 trades all over the year, with 7 winners and 0 losers, and a profit of 232 points per contract (+11.600 USD each contract!!!), this is the evidence of how the forecast works well.

We are in profit with every Market we trade since 2012, with all the trades documented, (except for Gold, where we had a very tough 2016 due to missed trends that started always in overnight).

We are traders first of all, and we want to look at numbers; this is the chart of our strategy performance since 2012 of the S&P500:


Hurry up! the Daily Report Service will not be available forever, a big change is about to come in the next months, and it will turn to a service for professionals to a price that will be 5 times higher than now. The reason is simple: it works and it is worth to spend even 20.000 USD per year if you can trade millions! The project for the future is to provide a Live line in streaming where to see the trades and the positions of my strategy in real-time. We will also provide tailored studies. If you do not take advantage of it now, you will regret it later, because if you subscribe it now, you will keep the same price for the next years.

More details in the next months...

And next week a new Market Forecast will be ready: Cotton!

You can find our services here: Service page:

Daily Report Service - The premium service
Weekly Report Service - Reports and studies every week.
2017 S&P500 Forecast Bulletin
2017 Corn and Soybeans Forecast Bulletin
2017 Live Cattle Forecast

You can read the previous Newsletters following this link:
http://archive.aweber.com/awlist3900413

Best Regards,
Daniele Prandelli
I Am in Wall Street Ltd

LinkedIn: https://www.linkedin.com/in/daniele-prandelli-3aab15112

e-mail: info@iaminwallstreet.com
Skype: I Am in Wall Street
http://www.iaminwallstreet.com
High Probaility Trading Techniques - S&P500, 30 Year Treasury Futures Bonds, Crude Oil, Gold, Corn, Soybeans, Wheat, Forex, Stocks, Silver, Live Cattle and S&P/ASX200.

Thursday, November 24, 2016

My "scrap" work about Wheat

A very polite customer has just told me that a study I sent to him in September was nothing but a scrap.
So, I have decided to share this my "scrap" study with you.

A customer asked me a study about Wheat for the last 4 months of the year, which I sent to him for 100 USD on the 1st of September 2016. My forecast was expecting a sideways Market with little movements, as it happened, so I focused the study and the possible strategy on the prices.

You can see the entire original study in the following PDF file, and here below the chart that sums up what I wrote in it and what happened so far.


And sometimes I'm even wrong! Can you imagine if my study was totally wrong? 


You can find new scrap work in my Service page:

Monday, November 21, 2016

2017 S&P500, Corn, Soybeans and Live Cattle Forecast - Now Available

Now available the new 2017 Forecast Bulletins
Find out more on our website:

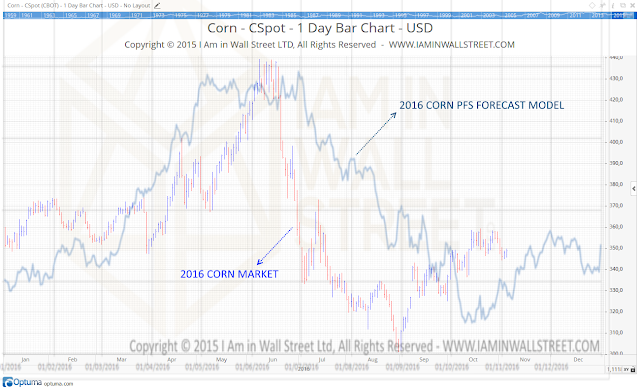
To show how the 2016 Forecast were, we just need to show you a few charts, and you will understand how powerful is our work

2016 Soybeans Forecast vs. 2016 Soybeans Market


2016 Corn Forecast vs. 2016 Corn Market

Are you sure you want to miss the chance to know in advance the trends of 2017?


Enjoy!

Friday, September 30, 2016

Live Cattle Forecast - Again Profits

We have closed today the SHORT position, again with a great profit! We did the SHORT at 108, and we closed it at 100.700. How could we do it? Well, you already have the forecast, it was available for free, and you knew we were expecting weakness from August till October! Here below you see all the trades! And pay attention, again: little losses and big profits!


You can see the forecast is PDF here:

From the forecaast you see that we were expecting the top in August, this is simply the reason of opening SHORT positions, and then the Market did the rest.

On the 8th of September I said to you, here in this newsletter:
"Now we have an important support in area 100-101.5, this is why we closed the SHORT position. We are ready to re-open a SHORT position after a bounce, using the Key Price at 108.100, always SHORT under it and FLAT above it".

And so, look at the Trades Record, we did exactly what we said, and we told it in advance to you! Do you still have doubts about our work?

Contact me for any question you have: info@iaminwallstreet.com.

If interested in our studies and services, please visit the order page

Thursday, September 29, 2016

Making Profits with the S&P500

We know how to make profits with the S&P500, we can say this after 4 years of constant profits. Today we want to show you how we can do it.
Here below is the performance of the last 4 years, where we keep the Record of every trade we do with the Daily Report Service:


In 2016, so far, we have a profit of 200 points. But it is easy to show you a Chart in Excel, I'm sure you want something real! As always, I show you a real account; do you know Tradestation 9.5? A great platform to trade, I really love it! It provides many tools to understand how you are trading. Here I show you my trading with the E-Mini S&P500 Future, December Contract; I started trading it on the 12th of September, sixteen days ago. Look at the details of my trading approach:


You have to focus your attention to some simple data: 
  • I have $3422 of profit and only $771 in loss
  • total number of Trades: 25; 16 winning and 9 losing
  • average winning trade: $213; average losing trade: $85
  • largest winning trade: $947; largest losing trade: $152 

There are many other details, but these here above are the most important to understand something really simple: profits must be bigger than losses! The strategy has to be based on this concept, you have to plan in advance this approach, and I do not know any other way to make profits. I use the same concept in every Market I trade.
In the last 2 months I have traded an account from $78.400 to $87.500. The result you see here above is not the result of luck, everything was planned in advance! But be careful: I'm not saying you plan in advance the profits, what you have to plan is the strategy! If your strategy gives you bigger losses than profits, there is something wrong in the strategy, in your approach! We always blame the Market, but we do not understand that the Market is just a mirror.

These profits are made following precisely the rules of the Daily Report Service, available to anyone interested to it.
Contact me for any question you have: info@iaminwallstreet.com.

If interested in our studies and services, please visit the order page.

You can read the previous Newsletters following this link: http://archive.aweber.com/awlist3900413

Best Regards,
Daniele Prandelli
I Am in Wall Street Ltd

Thursday, September 8, 2016

2016 Live Cattle forecast for FREE - Great Forecast

The 2016 forecast of Live Cattle was available to everyone for free. We were expecting a general... READ THE ARTICLE

Tuesday, July 12, 2016

2016 Bulletin - HALF PRICE NOW

The 2016 S&P500, Corn and Soybeans Bulletins are now sold at 50% of the original price, do not miss this opportunity!

Follow the link:
http://archive.aweber.com/awlist3900413/AcVQK/h/2016_Forecast_Bulletin_HALF.htm

Thursday, July 7, 2016

S&P500 Forecast and Live Cattle Situation

Two days ago I sent you the forecast... did you buy the S&P500?

Two days ago I sent a clear forecast, you see it here below, when Futures were at 2070 points, today we closed the LONG position at 2098 Points and we are FLAT... You had a live proof of what you get subscribing our service; what are you waiting for? Do you want to miss another movement of the S&P500? Subscribe it here
We closed the position because in area 2106 Points of the S&P500 Index we have an intermediate resistance, and at 2120 there is the massive resistance of the last 2 years.


Live Cattle, waiting and waiting...

Live Cattle is at the moment in a flat mood. We were waiting for an important up push, and we still are, but no life yet. In the last update about Live Cattle we said that if the August Contract was about to reach the level at 111.200, we had to be always LONG above it and FLAT under it. This contract found support exactly at this important area. Two days ago it did a Low at 111.075, reaching the day after almost 114.500.
We keep following this strategy, we take some profits when we have them and we let the remaining to run, always LONG above 111.200 and FLAT under it.

Wednesday, July 6, 2016

S&P500 - WHAT'S NEXT?

LET'S FOLLOW THE FORECAST OF THE LAST MONTHS... AND WHAT TO EXPECT IN THE NEXT DAYS

Step by step, I show you how we made 65 points of profits (this is the real profits we made with real money!) with a precise strategy, following the studies of our forecast. This is the forecast we did the 14th of May:


We were forecasting a continuation of the descent with a Low around the 20th of May:

Here below you see what happened to the forecast we provided in the Weekly Report: 


The downtrend went on, with a Low on the 19th of May, just the day before we forecast the Low and new up push. In the chart here below you will see it.

You see also that we are suggesting a new up push with a High in the first days of June and then down again. I also wrote "we try to take advantage of a possible up push".

And now see what happened, this is the chart published in the Weekly Report of June the 11th:


Did you like the up push we forecast from the 20th of June? It was 70 points of movement!
We had an important change in trend aroud the 15th of June, suggesting it as a Low, and confirming the forecast of 2 weeks ago, where we were expecting an up push till the first days of June and then down... Look:


Here we see a Low on the 16th of June...just one day after the day we forecast the Low. Let's see here below if an up push starts, nailing again the forecast.
You can see also, from the chart above, that we have a new forecast, which is a top around the 1st of July and then down...


A special event, the Brexit, made fall the Market, but look at the up push that started exactly on the 16th of June! Another good forecast! The fall due to Brexit is not a natural movement, I call them fake movements, and my forecast suggests to buy a few days later, for a top around the 1st of July (we made very good profits thanks to this call)...
(***before the Brexit I said to close all the positions and to not remain in the Market, because it would be like gambling, and we leave that to the losers, we do not do gambling***)


I suggested to the subscribers to buy on Tuesday, the day where the up push started after Brexit! All these charts are sent in advance, these are the original charts that I sent to the subscribers of the Weekly Report Service.


Hey, I was always underlining in every chart the importance of area 2000-2010, and it has been the support of the Brexit-fall, we actually used that support to buy, another good trading skill!


WHAT'S NEXT?

You see already the forecast in the chart here above, I'm expecting a High around the first of July (right now S&P500 at -1.10%, Futures at 2073 points). This drop should not last long, I'm expecting actually a buy opportunity around the 7th of July (+/- 1 day).


If you want to trade with us all these movements, with precise strategies, and also a semi-automated software*** that helps you to trade in intraday with our rules, you just have to subscribe our service... do you know anyone that can do better? This is only one of the several Markets we trade!


***the semi-automated software is not sent with the normal subscription, if you are interested to it, please contact me directly.

If interested in our studies, please visit the order page.

You can read the previous Newsletters following this link: http://archive.aweber.com/awlist3900413

Best Regards,
Daniele Prandelli
I Am in Wall Street Ltd


e-mail: info@iaminwallstreet.com
Skype: I Am in Wall Street
http://www.iaminwallstreet.com
High Probaility Trading Techniques - S&P500, 30 Year Treasury Futures Bonds, Crude Oil, Gold, Corn, Soybeans, Wheat, Forex, Stocks, Silver, Live Cattle and S&P/ASX200.

Tuesday, April 19, 2016

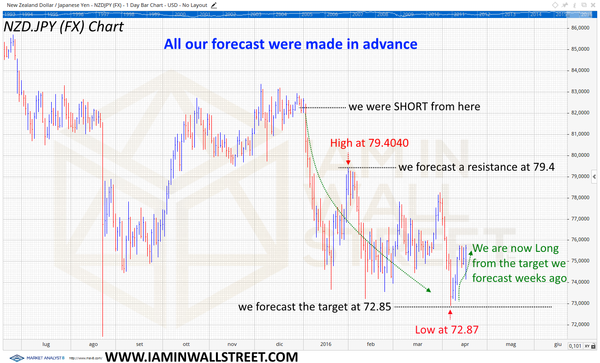
NZD.JPY - Our trading strategy - We hit perfectly the Low, we said that 50 days in advance

Sometimes the nature offers unbelievable opportunites! Look at our strategy here below with the pair NZD.JPY: on the 22nd of February we wrote in our Weekly Report that we had a support at 72.70; this level chages over the time, and on the 21st of March we said that this level of energy was now at 72.85; this is exactly what we wrote in the Weekly Report of March the 21st:

There had a very important level in area 82.7 now. We have to follow any trend starting from this area. So, we have the Key Price at 84.098, always LONG above it and FLAT under it, and we will be always SHORT under the Key Price 82.22 and FLAT above it.
We are SHORT from the Key Price 82.22 where we had the signal to be always SHORT under it. We have seen a Low at 73.2164, wonderful trade!!! We could make very good profits following the strategy. As always, we said to take part of the profits and let the remaining to run. 45 days ago I said also: in area 79.4 there is also a possible resistance; the top was on the 1st of February at 79.4040, and then it pushed down.
I said to take most of the profits because we were close to the main target at 72.70 (now 72.85)!!! Let’s wait for this level and then we will plan a new strategy. As I said, if we remain SHORT, just with a little part, and you can see actually this pair is now pushing up.
You see here the strategy of the last 2 months, do not forget this Report here above was written on the 21st of March 2016. You see what a big profit we could make. The Chart sums up the trades:
All these strategies are planned in advance, using precise rules to open and close positions with no doubt about what to do. This is just one of the Markets we are dealing, and we are doing well with every Market we trade (click here to see all the Market we study). In the previous Neewsletter I showed you the semi-automated system that we are creating to open the positions automatically; it showed a profit of +129.316 USD (5days ago). Right now the profit is +162.584 USD, +16.2% in 2 months and 10 days. In the next Newsletter we will see the performance in details of the system.
All the strategies for each Futures Market we trade are available in our Daily Report service, and here, again, we provide a real proof of our profitable work. 
If interested in our studies, please visit the order page

Tuesday, April 12, 2016

The Live Cattle Forecast Model is turning up!

Just a quick update about the strategy we are using to trade Live Cattle: the PFS Forecast Model is turning up and I want to follow it with a precise strategy (here is the Forecast Model). We are using the Key Price in intraday at 122.600, June 2016 Futures Contract, always LONG above it and FLAT under it (we use a 5 minute bar chart with intraday rules, explained to every subscriber).

If interested in our studies, please visit the order page.

Wednesday, March 23, 2016

Be careful guys! Trading remains the hardest job in the world to make money!

PROFITABLE FX EA REVIEW: Profitable Forex EA Review – 100% Scammer: I got reall y fed up with one of my FB “friends” trying to get me to join the Profitable Forex EA, and I’m finally doing a review so that...

Tuesday, March 22, 2016

What does make an analysis really useful?

After many years in the Market, what I see is always the same. We see so many people explaining what happened, but hardly what is happening, very rare what will happen. And I see NOW so many people explaining why on the 11th of February we saw a Low in Stocks and Crude Oil, or why T-Bonds topped on the same day. It is hard to find someone that on the same day was able to send an analysis that was clearly saying what was about to happen in terms of statistics (if someone doesn't speak in these terms, be careful, I would not trust him). We did it, and we shared with you weeks ago what we said to our subscribers on the 11th of February, you can download it here.

I admit I'm surprised to see how people prefer to follow news, free analysis and poor material to take trading and investment decisions instead of trying to learn listening to who shows real trades and strategies. Living in London I have learnt that actually Marketing is the most important thing to sell a product, and not the product itself. It is easier to sell hope than patience. And that's why it is always the same, people never learn, they just hope, and this seems endless.
I try! I really try to open the eyes to the people, because trading is also a matter of understanding the truth behind what we think, what we hope, and often also what we are. But honestly most of my subscribers are already people aware of what trading is, they understand it, and for this reason they follow my system since 2012, and between them there are a few big Banks as well.
Why my analysis is so useful to them? First, I think I don't pretend to be always right, I'm aware I can make a wrong forecast, and that's why I always plan a precise strategy. This is the thing that makes an analysis useful, the strategy. Unfortunately many people think that forecasts or news are the most important things, but evidence shows this is wrong! But as I said before, it is easier to follow a forecast than a strategy. The strategy is demanding, it takes discipline, time... a forecast needs just hope.

Summiing up, if you are a trader, or an investor, the biggest advice I can give is to follow analysis of who use numbers, track records, statistics. Do you understand that trading is just a matter of statistics? I use forecasts, cycles, you see I made important calls, I forecast every important grains trend of the last 2 years, I said 8 months in advance that October 2015 was a buy opportunity, that the January Crash (that I didn't forecast) was fake and again just a new buy opportunity, but this is not trading! Behind that there must be always a strategy to open and close positions. If you want to make money with news and forecast, I would be glad to dare you :p


PS:
Funny story, because sometimes I'm such a little bastard, this is what I sent to my subscribers exactly on the 7th of February 2016:
There are so many bad news, a negative sentiment here around, it is like everyone is expecting a new imminent crash and a new bear Market.
Here is one example:
http://www.theguardian.com/business/2016/jan/12/sell-everything-ahead-of-stock-market-crash-say-rbseconomists (it says we are at the same situation of 2008, the difference is that in 2008 no one was expecting what happened then, and now everyone is expecting the worst; and notice that the article was written on the 12th of January, when the Market already crashed). 
At the moment I don’t agree with this view, but we never know, and for this reason we keep using a price strategy, so we can protect the position if I’m wrong... I think we need a lot of patience, even because the Market is quite choppy, hard to handle. But, how can I say… I’m not expecting another downtrend or crash, that’s it. I can be wrong and we have to be prepared to it, but I’m also prepared to make good profits if I’m right.

This is the evidence of how this world is ridiculous and paradoxal, how the supposed gurus and the experts know literally NOTHING, and normal people like me know much more than them. It is up to you who you want to listen. Of course, you don't have to pay  them, and you have to pay my studies, but if you are good in math it should not be hard to understand what it is worth to do. 


In the next newsletters we will see how the Automated System is going, and we will have a look at Live Cattle, hironically the forecast is wrong at the moment (hironically because I was supposed to use this forecast to promote our work), but we protected the position with a precise strategy and now we are SHORT from 140.500.
If interested in our studies, please visit the order page 

Monday, February 8, 2016

2016 Live Cattle Forecast and Strategy

It is now available the 2016 Forecast and Strategy Report for FREE.
Visit the page: http://www.iaminwallstreet.com/Live_Cattle/2016_Live_Cattle_forecast.html
Sign up the Free Newsletters to get the 2016 Live Cattle Forecast and Strategy.

Tuesday, February 2, 2016

S&P500, CRAZY MARKET, NOT SO CRAZY FOR US...


After the strong drop of January, let me share with you what we said in our 
Weekly Report

On the 16th of January I sent this study to the subscribers:


  • The S&P500 did the highest High at 2133 points, in May 2015. 2133x0.875=1866, the S&P500 did a Low on Friday at 1858, only 8 points off, and from this level we have seen a bounce. Why 0.875? Because this is an important geometry, a natural division. 1/8=0.125 this is an important number. Seven times 0.125 is 0.875. It is like when we find the 50% of retracement, it is ½. Here I’m using 1/8, a value in harmony.

  • Do you remember when I gave you the most important support area at 1850-1882 Index Points? The S&P500 did a Low on Friday exactly inside this area, you know these values I use are not random, it has a strong meaning. It worked perfectly in August-September 2015, let’s hope it works now as well.

  • Opening my Market Analyst 8 Software, I saw the Low of Friday exactly at the Andrew’s Pitchfork line. This tool is there since December. If you look at the chart I sent you in the Weekly Report number 157, in December, you will see it with your eyes, I didn’t touch it, I didn’t adapt it to the Market. In the chart above you see the same tool, and the S&P500 just touched it. This is a very powerful tool, let’s hope it will this time as well.

  • Now we get deep. The last important down swing started on the 3rd of November 2015 at 2116 points, and the Low of Friday is at 1858:
2116-1858=258 (square of 16 is 256, interesting…)

The previous drop from May 2015 to August 2015 is 266 points:
            2133-1867=266

Since the last yearly uptrend started, in 2009, we have seen only one very big drop, in 2011; that movement started in July, the S&P500 did a High at 1356, and a Low in August at 1101:
            1356-1101=255
            In October we see a lower level, just one day under the August Low, in this case at 1075:
            1356-1075=281

In 2007 we see a High in December at 1523 and a sharp decline started, with a Low in January at 1274 and then in March at 1257:
            1523-1274=249
            1529-1257=266

The biggest drop, in terms of points, of the S&P500 before the year 2000 is in 1998, with a High at 1190 in July and a Low in September at 940 and in October at 923:
            1190-940=250
            1190-923=267

You see the numbers? 258-266-255-281-249-266-250-267, they were often movements where the Market did a very important change in trend (have you read the original courses of Gann? There are many pages where he notes the number of points or dollars of every swing, quite boring actually, I know, but still…). And often we can see also a usual pattern: the movement last for 2 months, no more than that, and often we see a double Low around the same level 1 or 2 months later. Every movement bigger than this range (250-280) in the last 20 years was the beginning of a new real downtrend. The biggest crashes without beginning a new downtrend have always been between these numbers. Over these numbers something even worst was coming.


CONCLUSION

How do you think we used our study? Obviously buying in area 1850 where we had the signal to be LONG above it! On the 20th of January we have seen a scaring movement under 1850 points, but it was only an intraday movement, not even closing under it, that was the strong signal for us to buy. Look at the Market right now: 


Our forecast and study read the Market in a great way, and we have been able to take advantage of it.
Yesterday we did another great move: before the opening we said to use a take profit at 1939 Points (March Futures Contract), and the High of the day has been 1940 Points. The Futures are now at 1897 Points.

Everything documented, everything planned. This is what you get and the opportunity we offer with our Daily and Weekly Report.

Is this study going to kee the Market up or is the bounce already finished? Which is the most favourite cycle, the most favourite next trend? I think we do have the reply!

 
You can read the previous Newsletters following this link:


Best Regards,
Daniele Prandelli
I Am in Wall Street Ltd


e-mail: info@iaminwallstreet.com
Skype: I Am in Wall Street
http://www.iaminwallstreet.com
High Probaility Trading Techniques - S&P500, Crude Oil, Gold, Corn, Soybeans, Forex, Stocks, Silver, Live Cattle and S&P/ASX200.

DISCLAIMER
It should not be assumed that the methods, techniques, strategies or indicators presented by e-mail, e-book, blog or files will be profitable or that they will not result in losses. There is no assurance that the strategies and methods presented in here will be successful for you. Past results are not necessarily indicative of future performance. The examples presented here are for educational purposes only. The data used is believed to be from reliable sources but cannot be guaranteed. The methods presented are not solicitations of any order to buy or sell. The author, publisher, and all affiliates assume no responsibility for your trading results, and will not be liable for any loss, damage or liability directly or indirectly caused by the usage of this material. There is considerable risk of loss in Futures, Stock and Options trading. You should only use risk capital in all such endeavours.

Monday, January 25, 2016

2016, What a Start!

WHAT A 2016!!!

Some updates from the Markets...

The 2016 has began with very strong and unexpected movements: Stock Markets deply down, Crud Oil lower and lower... but we are doing well with some awesome calls!


CRUDE OIL

Probably the most astonish forecast we made was on this Market, when one week before it was happening, we literally said in our Weekly Report: "next interesting level I have that can be a support is at 26.30-26.50". And here is the Chart we published in the Weekly Report:


And this is the Crude Oil Chart you can see right now:


STOCKS

We are doing some very good trades with the Stocks. Here is the Strategy we used with Disney: "In case of lower levels, we use 91.24, if tested, we will be always LONG above it and FLAT under it". We snet out this strategy on the 17th of January, and now you can see the results:


This is what makes the difference, when you know in advance which prices are influencing each Market.


S&P500

This Market was very hard to handle because of the crazy volatility, but we made a deep and clear study to support our view and how we are approaching our trading with the S&P500. In respect of the subscribers we cannot share it here, if you are interested, subscribe our Daily or Weekly Report, we think very good profits can me made soon considering the forecast we have!


US DOLLAR FORECAST

The US Dollar is slowly moving, but our forecast is correct so far, following the right trend. This is a new Market for us and you can get our forecast with a very low price. If you are interested to it, you should not miss the chance to get it, it's just $30! You can even check how the forecast worked in the previous years.


GRAINS

For what Grains can offer right now, we are doing very well, little trades but mainly in profit. Grains are mainly stuck in a sideways phase, but the important movement will come, and we have a strong forecast telling us what and how it will happen. Subscibe the Daily or Weekly Report to follow our strategies, or buy the 2016 Grains Bulletin, you will receive also updates over the year about our favorite strategy and which prices we are looking at to trade Corn and Soybeans.


You can read the previous Newsletters following this link: http://archive.aweber.com/awlist3900413

Best Regards,
Daniele Prandelli
I Am in Wall Street Ltd


e-mail: info@iaminwallstreet.com
Skype: I Am in Wall Street
http://www.iaminwallstreet.com
High Probaility Trading Techniques - S&P500, Crude Oil, Gold, Corn, Soybeans, Forex, Stocks, Silver, Live Cattle and S&P/ASX200.